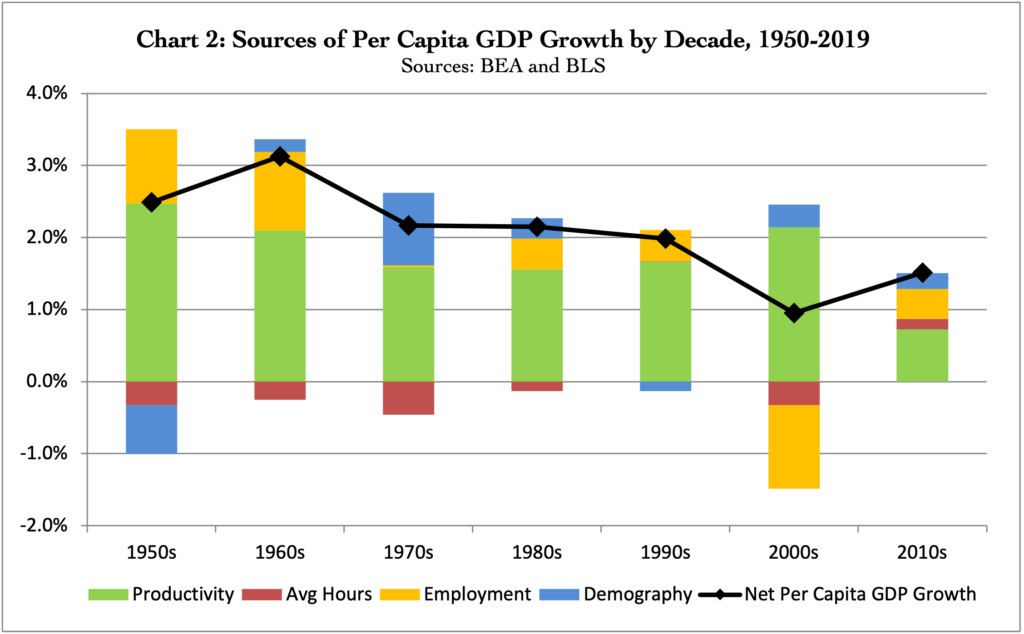
As a starting point for our analysis of the declining performance of the US economy, Chart 2 shows real per capita GDP growth broken down into four contributing sources: (1) Productivity, (2) Average Hours, (3) Employment, and (4) Demography. The black line shows net per capita GDP growth aggregating the contributions of the four sources.
The Four Sources of Per Capita GDP Growth
- Productivity measures how much economic output is generated for each unit of labor input. Growth in labor productivity is the foundation of higher incomes, with the other three factors adding or subtracting from that base. The overall trend of productivity growth over the last seven decades is down, with the 2010s posting a growth rate less than one-third the rate of the 1950s.
- Average Hours captures changes in the number of hours the average employed person logs. Average Hours has typically created a small drag on income growth. That drag is thought to be a function of shifting employment patterns towards sectors of the economy where part-time employment (fewer hours worked on average) is more common, such as the food services and personal services sectors.
- Employment measures changes in the portion of the working age population that is actually employed. Changes in the employment rate result from both long-term decisions of Americans to enter or exit the labor force and short-term fluctuations in employment due to business cycles. After productivity growth, changes in the employment rate have the biggest impact on per capita income growth. While the overall trend is toward a higher employment rate, the 2000s are notable for the sharp decline – a decline not solely attributable to the Global Financial Crisis (GFC).
- Demography captures the impact of changes in the age distribution of the American population. Higher proportions of children and the elderly subtract from per capita GDP since these demographics are less likely to be employed, whether due to school, retirement, or other factors. After the post-war Baby Boom, demography has typically contributed modestly to per capita GDP growth, but that will change in the future as the American population grays.
Historical Narrative
1950s and 1960s: Per capita GDP growth during the 1950s benefitted from strong productivity growth and increases in the employment rate, while the demographic impact of the Baby Boom and a small decline in Average Hours subtracted a full 1.0%, leaving net growth at 2.5%. Higher employment rates continued to boost growth through the 1960s, and with productivity growth holding above 2.0% and the demographic headwind of the Baby Boom turning into a small tailwind, per capita GDP growth exceeded 3.0% – the only decade to reach that level in the entire post-WW2 period.
1970s to 1990s: Productivity declined sharply in the 1970s due to the energy shocks of that decade, and earlier gains in the employment rate leveled off. But with the Baby Boom turning into a Baby Bust, demographic change added a full 1.0% to growth, leaving the net at 2.2%. Surprisingly, the 1980s showed no improvement in net growth over the crisis-ridden 70s – productivity growth for the decade even declined slightly. Even more surprising is that per capita GDP growth of the 1990s failed to match even the weak results of the 70s or 80s. While productivity growth increased slightly to 1.7%, in the aggregate growth fell just shy of the 2.0% mark.
2000s: The new millennium finally brought a rebound of productivity growth north of 2.0%, but this was accompanied by a remarkably sharp decline in the employment rate. While the GFC contributed to this decline, even without that event the employment rate would have registered as a major drag on growth for the decade. That this decline occurred while productivity rose is a key puzzle to be explained. For the decade as whole, per capita GDP growth hit its lowest level of the whole post-WW2 period – a measly 1.0%
2010s: Finally, we have the 2010s, which saw a collapse of productivity growth to an average of 0.7% for the decade. Only the beginnings of a recovery in the employment rate, and small contributions from demography and average hours kept the net growth rate above the post-war low of the 2000s.
Conclusion
All is not well in the US economy. Productivity declines and employment rate volatility are the key factors to be explained. Productivity has clearly been on an overall downward trajectory since the 1950s. While employment rate declines appear to be isolated to the 2000s, once we begin to dig deeper, we will see that that the seeds of this decline were planted decades earlier. The exceptionally weak economic performance of the last twenty years is the culmination of events and trends reaching back many decades. In charts that will follow, explaining why productivity growth has declined, and what’s driving changes in the employment rate will be the focus of the analysis.