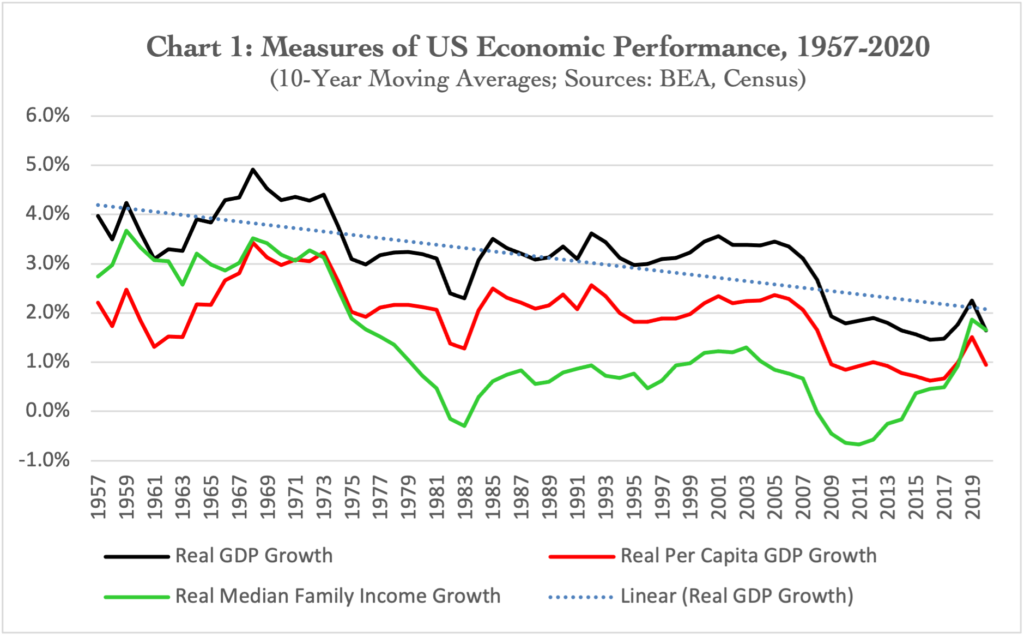
By almost any objective measure, the performance of the US economy has deteriorated sharply over the last five decades. Real GDP growth (BEA Table 1.1.1), shown by the black line, averaged 4% in the post-war period until the energy crises of the 1970s. Yet it never fully recovered its former growth rate once that shock had passed. The 1980s, while sometimes remembered as a time of dynamic growth after the double-dip recessions of 1980 and 1981-82, were hardly better than the crisis-ridden performance of the previous decade. The 1990s and early 2000s posted growth rates similar to the 1980s, albeit with the reduced volatility of the supposed “Great Moderation,” until the Global Financial Crisis (GFC) revealed the folly of our policymakers and drove trend GDP growth well below 2%. Nearly a decade later trend growth finally started to recover above 2% and then the Covid pandemic hit in early 2020.
Taking demographics into account, per capita GDP growth (BEA Table 7.1), shown by the red line, tells a similar story. Per capita growth of the 1950s and early 1960s was slower than aggregate GDP growth due to the baby boom. A gap of nearly 2% between the two series progressively narrowed thereafter. Sustained growth of 3% into the early 1970s then decelerated with the energy crisis. Growth rates of the 1980s and 1990s barely recovered from the troubled 1970s before the GFC pushed trend growth below 1%.
Of course, per capita income as a measure of general economic performance is skewed by the income gains of the very wealthy. To get a sense of how families in the middle of the income distribution fared, the green line shows the growth rate of Real Median Family Income (Census, Current Population Survey, Table F-7). This is the starkest indicator of the weakening performance of the US economy. Consistent growth rates of 3% during the 1950s and 1960s fell precipitously in the 1970s – actually turning negative in the early 1980s. The median family continued to fare poorly thereafter, with trend income growth never exceeding 1% until the 2000s. The GFC then hammered their economic well-being even further, with sustained declines in income over seven years. At its trough in 2012, Median Family Income just barely exceeded its level of 1989, more than two decades earlier.
What happened? Some prominent economists have acknowledged the deterioration after the GFC – Larry Summers labeled it ‘secular stagnation’ – and academic economists have analyzed various aspects of the longer-term problem. More policy-oriented economists of the left and right have also offered up cures consistent with their ideological biases. Yet, we still don’t have a comprehensive explanation for what went wrong. The prevailing explanations are piecemeal. They fail to either provide a comprehensive interpretation of the long-term facts or get to the root cause of our ills.
In the charts that will follow over the coming weeks, we will peel the onion on US economic performance to get to the heart of the malaise. No sophisticated economic theory is required – the data tell the story if we’re open-minded enough to listen. It’s a story of how the economy actually works in the real world – as an evolving, human, historical system – rather than how it should work based on the high-level abstractions of economic theory. Stay tuned.