Key Takeaways from Chart 5 and Commentary
- Just as the performance of a stock market index reflects the weighting and performance of its underlying stocks, the aggregate productivity of the economy reflects the weighting and performance of the various industries that comprise it.
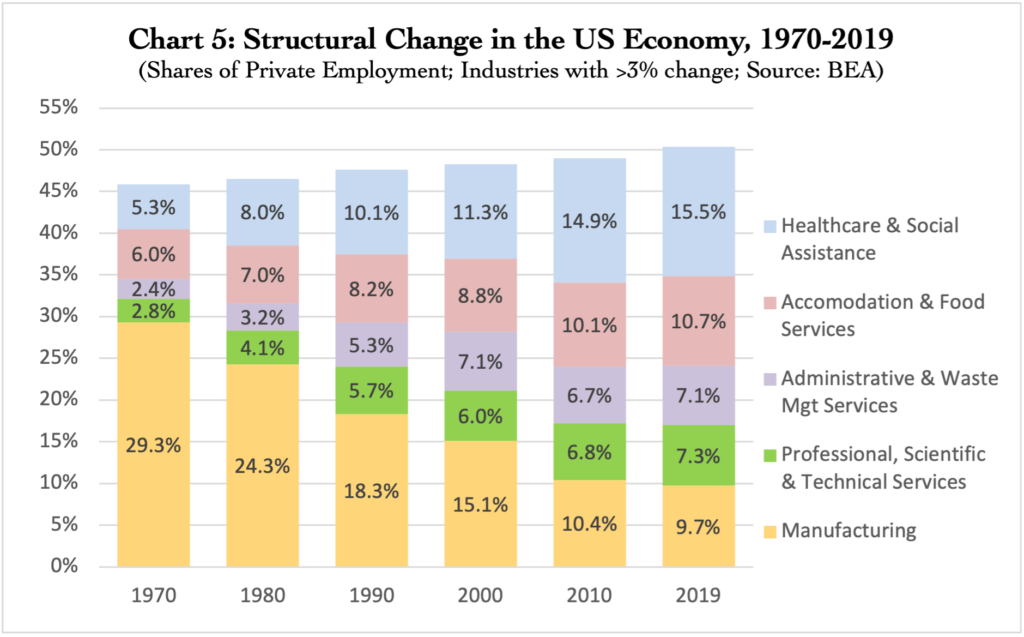
- As manufacturing employment has declined as a share of private employment other industries have necessarily increased their shares.
- These structural changes in the distribution of labor across industries have structural consequences for US productivity growth.
- The decline of employment in the high value-added output, high productivity growth manufacturing sector, and growth of employment in lower value-added output, lower productivity growth services industries in the primary cause of the slowdown in US productivity growth.
- Upcoming charts will quantify this impact.

Commentary
The previous chart in this series showed the decline in US manufacturing employment in absolute numbers since its peak in 1979 and as a share of private employment. Of course, if manufacturing employment is declining as a share of private employment, then other industries must be increasing their share. Chart 5 above shows the four major industries that have expanded employment most significantly as manufacturing has declined. These structural changes in the distribution of employment across the various industries that comprise the US economy necessarily impact US productivity growth: just as the performance of a stock market index reflects the weighting and performance of its underlying stocks, the aggregate productivity of the economy reflects the weighting and performance of the various industries that comprise it. Structural changes in US employment across industries have structural consequences.
“Within sector” labor productivity: The labor productivity performance of any individual industry is a function of two metrics: (1) the level of value-added output per unit of labor input, and (2) the growth of that value-added output level over time. Naturally, industries have differing levels of value-added output and growth rates. In 2019, for example, the annual value-added output in the manufacturing sector for each full-time equivalent employee was approximately $189,300, and this level of output per employee grew at a real compound annual rate of 3.2% from 2000 to 2019 (BEA; 2012 dollars). In contrast, in the Accommodation & Food Services industry, the comparable annual value-added output for each employee was $58,100, and this level of output per employee decreased at a real compound annual rate of -0.5% from 2000 to 2019 (BEA; 2012 dollars). These differences in “within sector” labor productivity performance across different industries could be due to the quantity or quality of capital employed, the quality of labor inputs, the production processes used and any improvements or knowledge gains applied to those processes, as well as attributes of what is being produced and changes in those attributes over time, among other factors.
Shift effects: Each industry’s share of labor resources also changes over time, as Chart 5 illustrates, whether due to trade, changes in demand, productivity growth, government policies, or other factors. Some industries are expanding their share of employment while others are contracting. Because each industry has different productivity levels and growth rates, shifting labor resources between industries also changes the weightings and contributions that each industry makes to aggregate productivity.
The impact of these shifts could be due to differences in productivity levels, productivity growth rates, or both. Consider labor shifts between industries with different productivity levels. Suppose two industries have the same labor productivity growth rate, but different levels of value-added output per employee. If workers move from the sector with lower output per labor input to the sector with higher output, that shift alone will increase aggregate labor productivity growth during the period when that shift takes place, even if both industries have identical labor productivity growth rates. Of course, the converse is also true – moving labor from higher output industries to lower output will decrease productivity growth. Alternatively, consider labor shifts between industries with different productivity growth rates. Moving labor resources from the lower productivity growth industry to a higher growth industry will provide an ongoing boost that improves aggregate labor productivity growth for as long as the growth rate differential persists.
We can refer to the cumulative impact of employment shifts between industries on the levels of labor value-added output and productivity growth rates as shift effects. In the most beneficial scenario, labor would move from industries with lower levels of value-added output and lower productivity growth rates to sectors with higher levels of value-added output and higher productivity growth rates. Conversely if labor resources are moving from industries with higher output levels and productivity growth to those with lower output levels and productivity growth rates, as a matter of simple arithmetic, aggregate productivity growth must decline.
In the charts that follow, I will quantify the impact of these changes. As we will see, the slowdown of US productivity growth is in large measure a straight-forward consequence of structural change in the distribution of labor across the industries that comprise the US economy. The decline in high productivity manufacturing employment and the corresponding growth of lower productivity services industries is the primary cause of the slowdown in US productivity growth.